Get in touch with Yibo Company


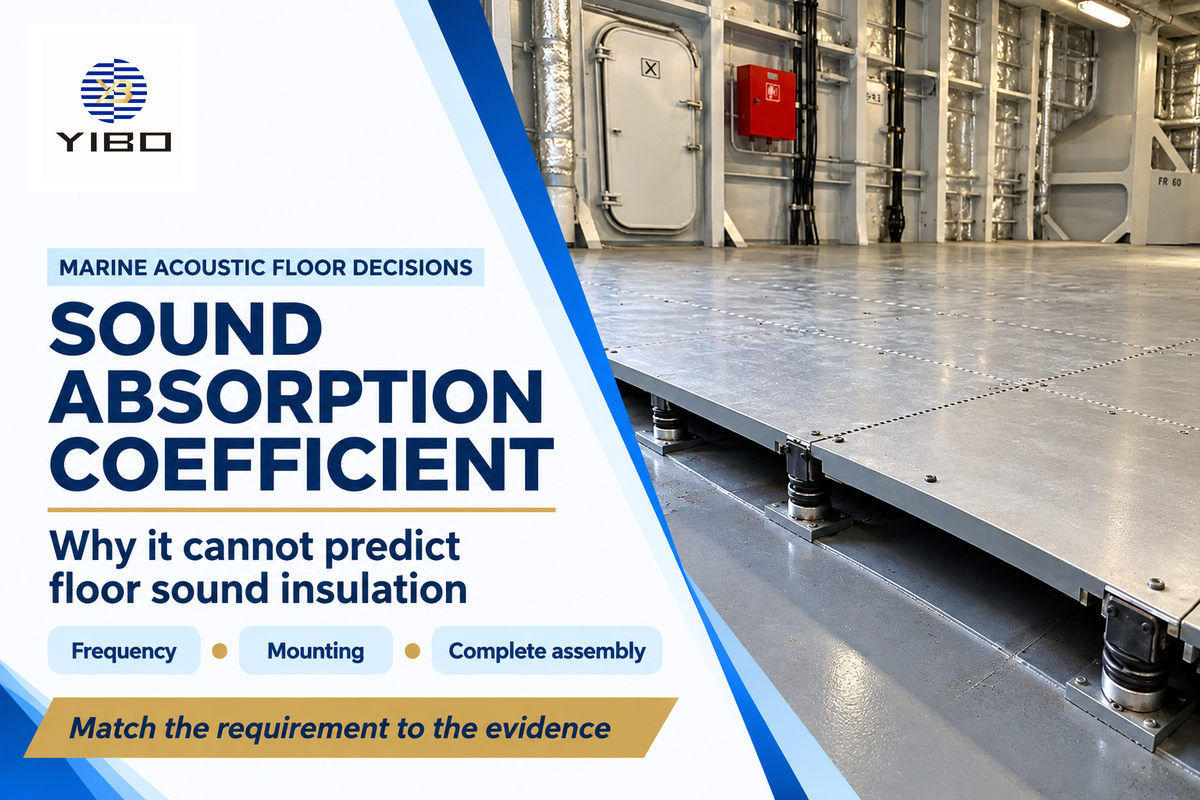
The sound absorption coefficient describes the behavior of a surface in relation to incident sound under specified test conditions. In selecting a deck system for a shipyard, that number answers a completely different question from how much sound passes through the entire floor. Combining the two can put an effective absorber in the wrong application.
Updated October 2026
Quick reference
- Surface absorption: dimensionless coefficient, reported by frequency.
- NRC: average at 250, 500, 1,000 and 2,000 Hz.
- Equivalent absorption area: square metres or square feet, with the convention stated.
- Floor isolation: complete-assembly airborne or impact results.
- Cabin noise: sound pressure measured in the occupied space.
Sound absorption coefficient specifies surface absorption under specific conditions. A number of 0.60 at 500 Hz isn’t 60 dB of floor insulation. Compare the quantity, frequency and tested assembly, prior to evaluating the acoustic products.
- A chamber coefficient above 1 can be a valid reported result.
- A high average can conceal weak absorption in the machinery-noise bands.
- Exposed acoustic panels, buried resilient layers and damping coatings have different jobs.
- Report matching improves a comparison; installed performance still follows the complete sound path.
What the sound absorption coefficient actually describes
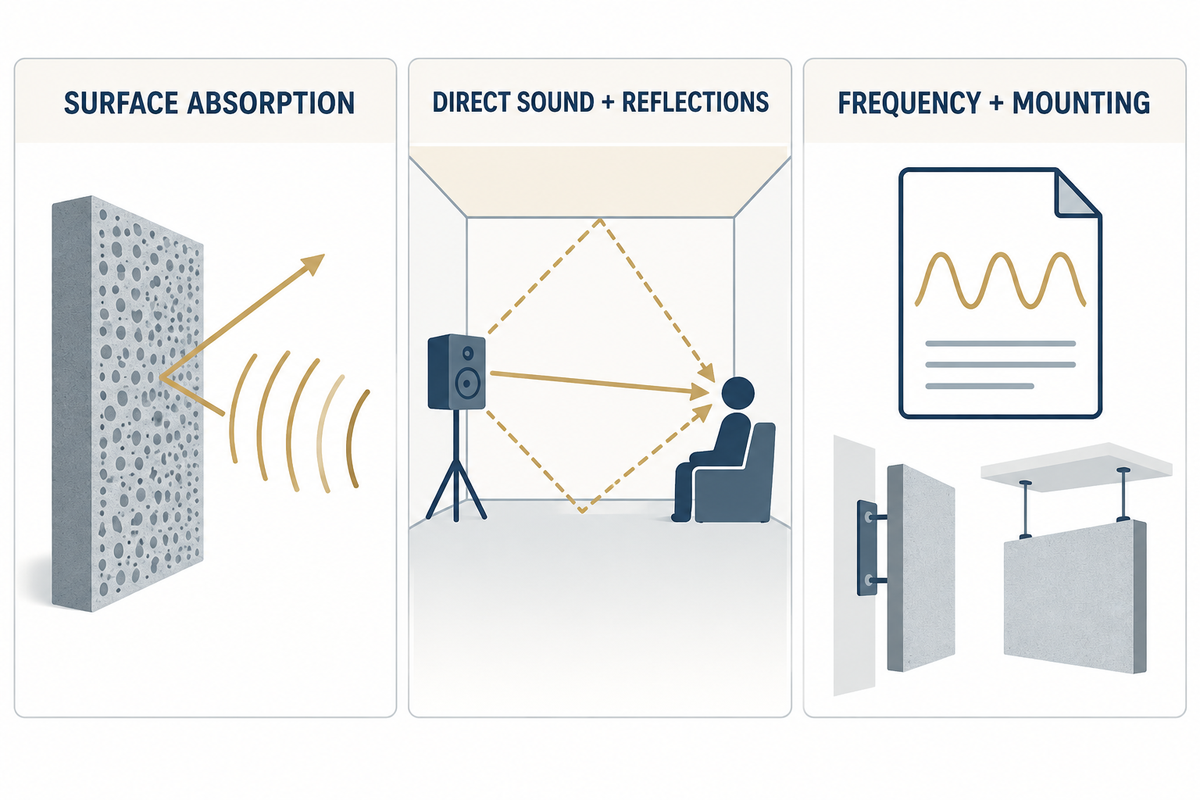
Acoustic absorption describes the fraction of incident sound energy that isn’t returned as reflected sound, under the specified measurement conditions. The ideal coefficient ranges from 0 to 1. Laboratory chamber results use an operational area-based definition, so their interpretation also includes the specimen geometry and the sound field.
When a sound wave hits one surface, some sound energy is reflected by the material. Air motion through the structure in a porous absorber dissipates energy as heat. A different amount of sound energy is absorbed when the material, frequency or mounting conditions change. An open boundary can also remove energy from a room without insulating the next space.
Sound absorption is defined here for acoustics, not optical attenuation per unit length. The coefficient has no metre-inverse unit. Daniel Russell’s university-hosted absorption teaching notes explain the distinction between incidence conditions and the frequency-dependent properties of a material.
A coefficient of 0.60 for a degree of sound absorption refers to a stated band and isn’t a claim that every sound in the room is 60% quieter. The amount of sound reaching a listener includes direct sound, reflections and other modes. Absorption can inform acoustic calculations, but one surface number leaves those paths unresolved.
Reverberation is the prolongation and mixing of sound due to repeated reflections after a source stops. Closely spaced reflections merge rather than arriving as distinct echoes. In a small reflective room, that mixing of sound echoes can obscure speech. Treating suitable exposed surfaces addresses the reflections, but stopping the entry of unwanted noise requires addressing the transmission path.
For a 500 Hz comparison, retain the 500 Hz values and the tested mounting. A supplier’s 1,000 Hz result answers a different part of the spectrum. Buying on the larger of two unmatched numbers rewards the reporting choice rather than the right sound absorption for the vessel.
Measuring absorption: reverberation room or impedance tube?
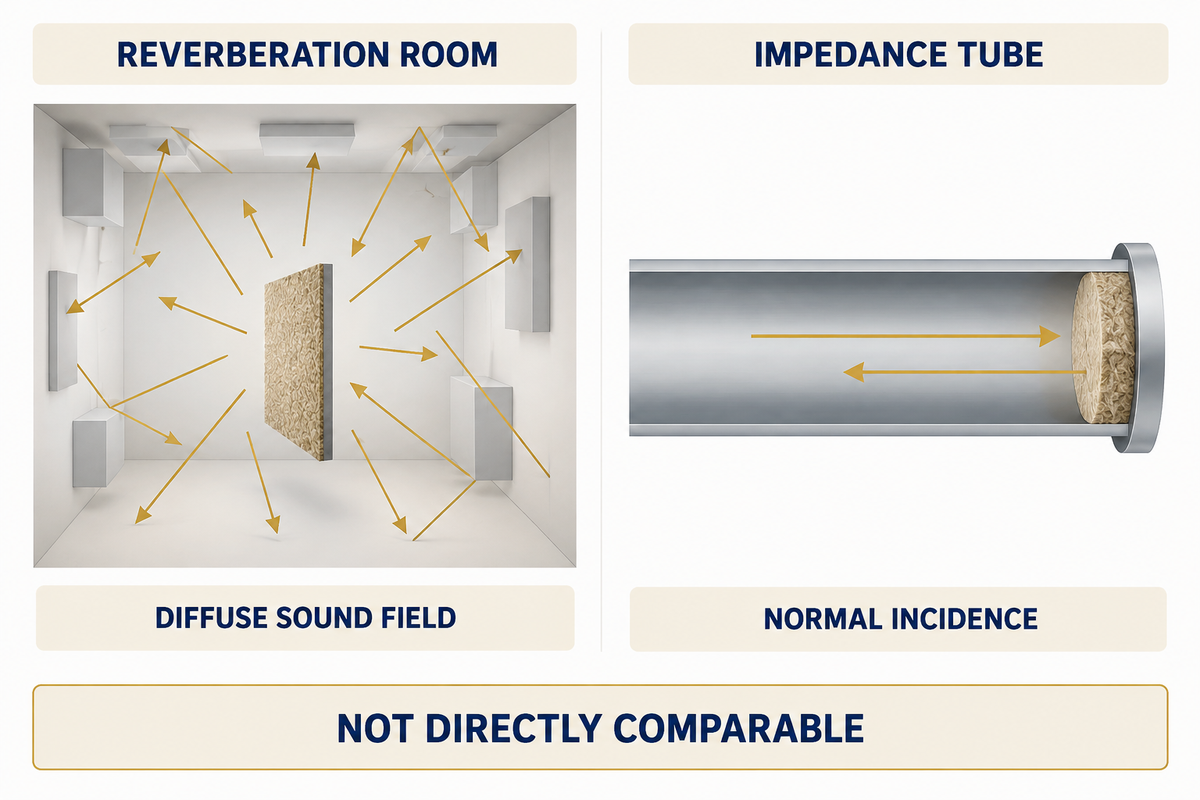
Reverberation-room measurements assess absorption in a diffuse sound field. An impedance tube measures a specimen at normal incidence. The two methods expose absorbing materials to different sound fields. Selecting materials requires a like-for-like method comparison before differences in coefficients can be treated as product differences.
How is the sound absorption coefficient measured?
The specimen is measured by specified laboratory methods. These include sound-decay measurements in a reverberation room or pressure measurements in an impedance tube. A room test compares how sound is absorbed with and without the specimen. A tube test evaluates the incident and reflected wave behavior. The laboratory measures the material to be measured, specifies its dimensions, and describes how it’s mounted.
ISO 354:2003 covers room measurements of absorbing treatments and equivalent absorption area. ISO 10534-2:2023 states that normal-incidence tube results are not directly comparable with random-incidence chamber results. Its qualified estimate for locally reacting materials is not a universal conversion for a layered marine floor.
Reverberation room
- Diffuse-incidence objective
- Larger installed specimen
- Mounting and exposed edges matter
Impedance tube
- Normal incidence
- Specimen fits the tube cross-section
- Useful for controlled material comparison
Measuring the sound absorption coefficient means recording the backing. A rigid plate, open cavity or air gap changes how sound behaves at the sample. A 25 mm specimen directly against a plate and the same specimen above a 25 mm air gap are two test constructions. Regard the air gap as part of the product for comparison.
Laboratories test various materials to absorb a portion of incident energy, including fibrous treatments and faced panels. Comparing the capacity of the materials requires the same test basis. Absorption depends on the complete exposed construction, so a ceiling panel’s facing belongs in the sample description alongside its core.
Read frequency data before choosing sound-absorbing materials
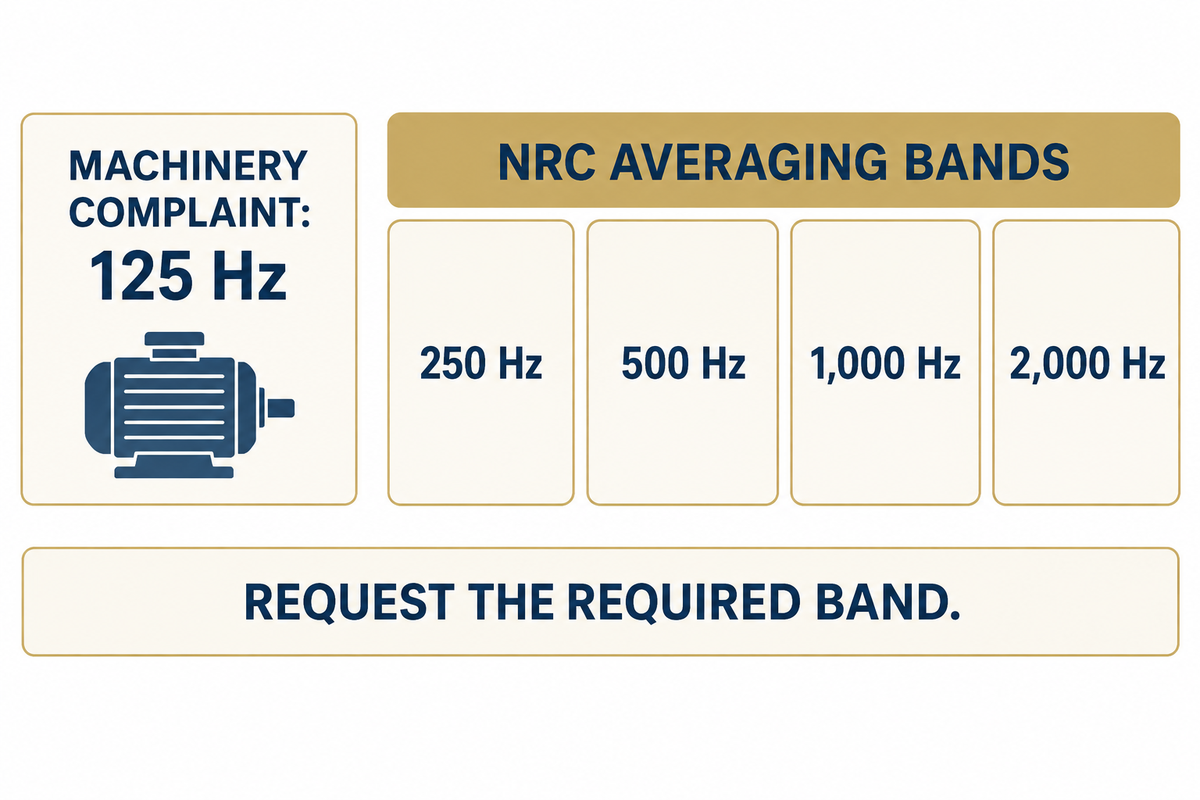
Frequency data identifies where a sound-absorbing material works. A single average can condense that information and mask bands associated with a complaint. For machinery-related excessive noise, start with the source spectrum and the associated absorption curve; for reverberation, look at the exposed materials and surfaces within the given range.
What is a good NRC value?
A higher NRC indicates more average absorption across its four rating bands when the test conditions match. Use it to shortlist treatments for room reflections, then select on the required bands. A 125 Hz problem needs 125 Hz data because NRC averages 250, 500, 1,000 and 2,000 Hz. No single NRC value accepts a marine floor.
The absorption coefficient of a material varies with thickness, facing and backing. Density alone doesn’t determine the best acoustic treatment. Testing by Trevor Cox of porous absorbers demonstrates why different materials with similar descriptions may act differently.
Commonly used materials such as mineral wool and foam absorb sound through their porous structure. Solid wooden panels require a different construction from a porous face, if used for absorption. In either case sound reflection follows the exposed surface and the layers behind. Selecting the right materials first depends on the exposed surface construction, not on the material family.
“Not all mineral wools are good acoustic absorbents, and density alone is not enough information to be sure of their performance.”
Example: a shipyard is comparing acoustic wall panels for a crew mess where conversation lingers after speakers stop. One report includes a mounting cavity; the second uses direct fixing. Procurement first separates those constructions instead of ranking the headline averages. Meanwhile, a nearby cabin has a machinery-related complaint concentrated around 125 Hz. Moving the mess-room panel shortlist into that cabin review would skip the low-frequency requirement. The technical reviewer takes the 125 Hz result and the transmission path back to the cabin specification. Panels suit the exposed-reflection problem; the cabin may need source isolation or a different deck assembly. Both areas need good acoustics, but they’ve different selection criteria.
Below 250 Hz, the rating curve in ISO 11654:1997 does not assess absorption. A low weighted absorption rating can conceal useful narrow-band performance. Frequency curves therefore protect procurement from rejecting a suitable narrow-band treatment as well as from buying an unsuitable high-average one.
Applications of sound absorption on walls and ceilings include managing reverberant buildup in shared spaces. This is influenced by the materials in the space and exposed areas. Understanding the sound absorption curve helps identify which treatment addresses the complaint, rather than distributing the same panel across every compartment.
NRC, STC and Rw answer different questions
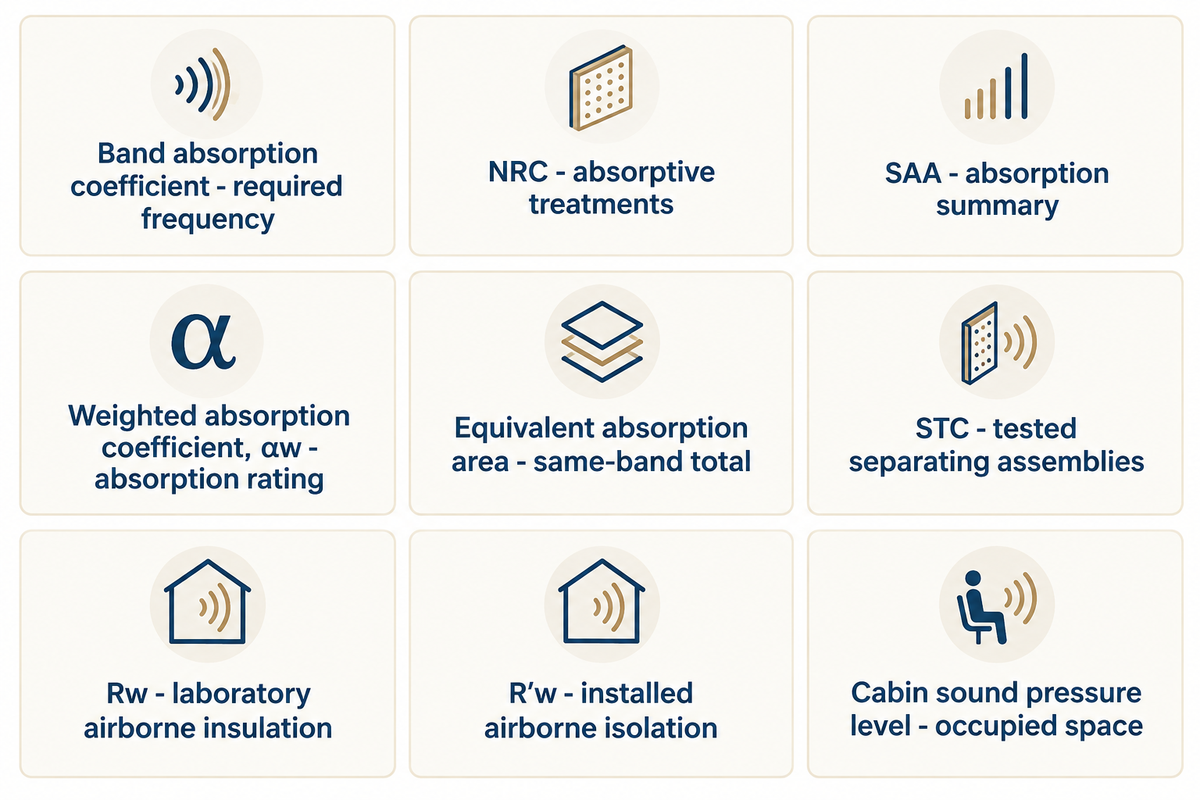
The noise reduction coefficient, NRC, summarizes absorption. STC and Rw rate the airborne sound isolation. A cabin sound level describes the noise at the measurement location. Use absorption to control reverberation, assembly ratings to compare separating constructions, and onboard measurements to assess the space under its operating conditions.
What is the difference between STC and NRC?
STC rates airborne sound transmission through an assembly; NRC averages how much incident sound a treatment absorbs at four frequencies. A higher NRC value indicates better sound absorption under its test conditions. A higher STC value indicates better rated airborne sound isolation under its test conditions. Neither number directly supplies the other, and neither alone provides the level of sound in a working vessel.
ASTM E413 warns that machinery and other spectra unlike speech or television need frequency analysis. ISO 717-1:2020 defines single-number ratings for airborne sound insulation. Treat the frequency range behind each rating as part of acoustic control.
| Quantity | Reported form | Decision it supports |
|---|---|---|
| Band absorption coefficient | Dimensionless, with Hz band | Compare absorption at the required frequency |
| NRC | Four-band average, rounded to 0.05 | Shortlist absorptive surface treatments |
| SAA | 200–2,500 Hz third-octave average, rounded to 0.01 | Compare an absorption summary on its own basis |
| Weighted absorption coefficient, αw | ISO 11654 single rating | Compare absorption ratings with curve shape retained |
| Equivalent absorption area | m² or ft²; per object where applicable | Build a same-band absorption-area total |
| STC | Airborne-insulation rating | Compare tested separating assemblies |
| Rw | Weighted sound reduction index, dB | Compare laboratory airborne insulation |
| R′w | Apparent weighted reduction index, dB | Describe installed airborne isolation including field paths |
| Cabin sound pressure level | dB with weighting and operating condition | Assess the noise in the occupied space |
The averaging conventions used in this table, and NRC and SAA, are explained by Intertek’s laboratory method statement. The official publication of the 2012 Code on Noise Levels on Board Ships clarifies Rw (laboratory), R’w (apparent installed), onboard sound levels. Fire classification belongs in a separate part of the assembly specification.
A 50 dB Rw result isn’t the same as a 50 dB(A) cabin result. Nor can a buyer subtract that rating from an engine-room reading to obtain cabin noise. Flanking paths and the source spectrum are always part of the calculation, even with a floor with a good lab rating.
What an absorption-area calculation can tell you
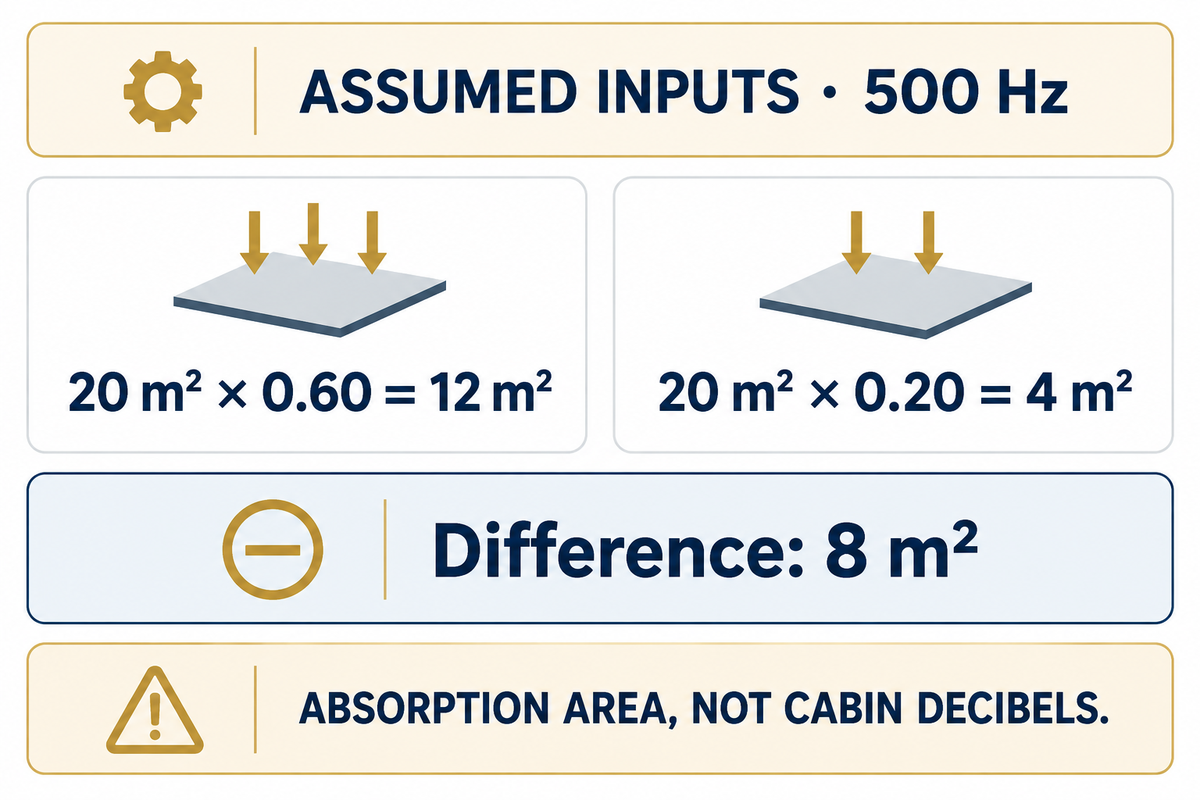
Equivalent absorption area = surface area x absorption coefficient. For a frequency-specific comparison, use A = α x S, keeping the same frequency, mounting and units. The result describes an absorption-area contribution; for a room prediction, its geometry, other surfaces and sound-field assumptions need to be analyzed.
Assumed inputs: a 20 m² exposed surface treatment has α = 0.60 at 500 Hz in the specified mounting. Its absorption area is 20 × 0.60 = 12 m². Covering the same 20 m² with α = 0.20 describes an absorption area of 4 m² at 500 Hz. The difference is 8 m².
Procurement can use that result to evaluate the absorption contribution of the two treatments, as long as the test bases are the same. A calculator can’t transform the 8 m² difference into a reduction of cabin decibels. Adding other surfaces requires their own areas and the same band coefficients, followed by a room model that’s appropriate for the space.
Total absorption area is the sum of those compatible contributions. For individual objects, use the reported area per object rather than creating a surface coefficient. The ASTM C423 significance statement also explains why practical areas and non-diffuse sound fields may differ from the arrangement in the laboratory.
An area of 12 m² of absorption doesn’t mean 12 dB of insulation. Leaving the square-metre unit visible prevents a legitimate arithmetic comparison from becoming an empty and meaningless promise. Neither doubling exposed area nor choosing a higher coefficient sets the cabin sound pressure by itself.
Compare acoustic reports with the 5-Field Report Match
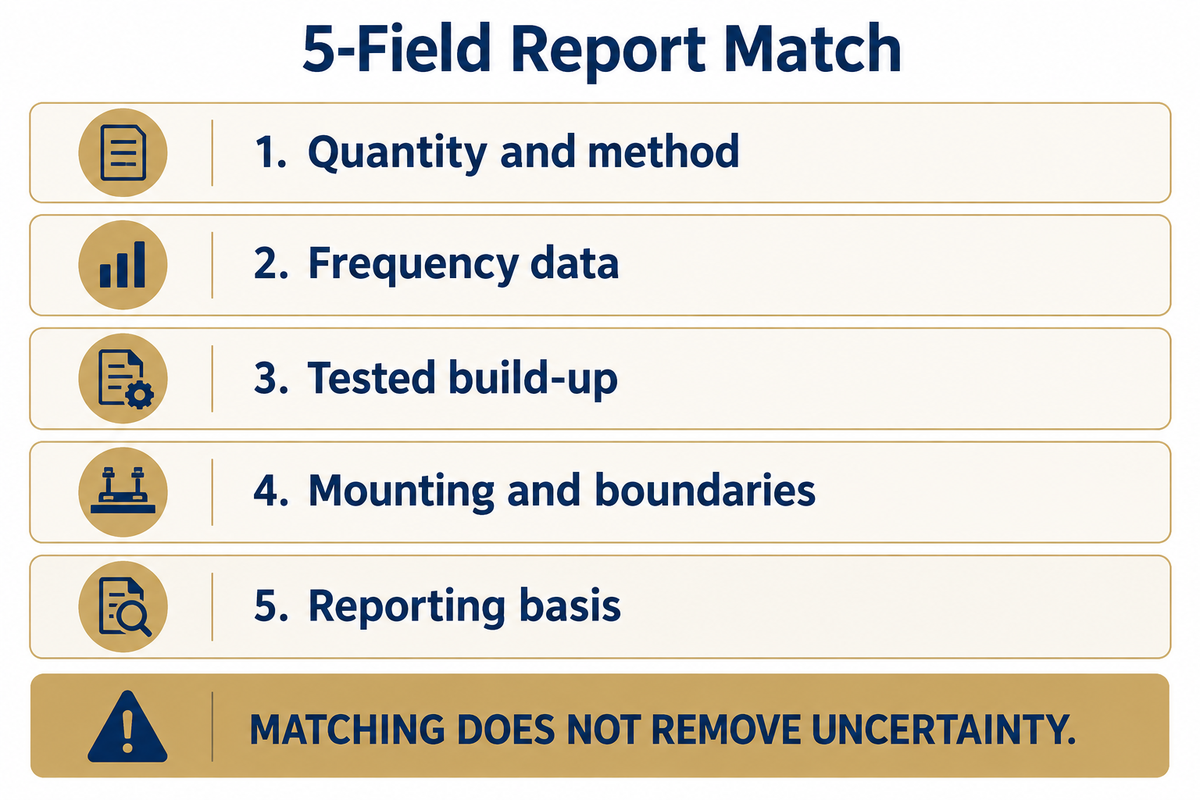
The 5-Field Report Match sorts two acoustic reports by quantity, spectrum, specimen, mounting and reporting basis. Matching supports a more precise comparison of the products. A change in a field indicates the condition that requires a technical review. Matching doesn’t remove the uncertainty in measurement and won’t make a laboratory sound field identical to the installed field.
5-Field Report Match
A five-point reading method for separating approximately comparable acoustic results from differences caused by the construction of the test.
| Field | Record together | Action when different |
|---|---|---|
| 1. Quantity and method | Absorption, transmission or impact; standard and edition | Keep different quantities in separate decisions |
| 2. Frequency data | Band centres, band width and summary calculation | Compare common bands; retain missing bands as gaps |
| 3. Tested build-up | Product identity, facing, thickness, density and layers | Resolve substitutions against the test specimen |
| 4. Mounting and boundaries | Backing, cavity, edge treatment, attachments and loaded condition | Review the changed boundary before ranking |
| 5. Reporting basis | Laboratory, date, area, rounding and stated uncertainty | Retain the original report rather than the brochure number alone |
ASTM E795 views mounting as part of absorption measurement. The edges of the material may also affect the result of a chamber. The sound absorption properties of the material are expressed for that tested arrangement, not every possible fixing detail.
An example will illustrate the point. Example: There are two bids each describing a 40 mm acoustic layer. One bid reports a perforated facing with a rear cavity and the other bid reports a specimen with no facing mounted on a rigid backing. Equal thickness doesn’t make the reports matched. The buyer documents the differences, and compares only the assemblies offered. If the shipyard intends to cover either product with an impermeable finish, the exposed surface must be reviewed. No numerical correction is guessed. A separate bid carrying Rw instead of absorption coefficients goes into the floor-isolation review. That bid has answered a different question, even if its brochure uses the same acoustic insulation wording.
A change from a 25 mm to a 50 mm cavity changes the test construction, not merely a drawing note. The report match preserves that distinction before the commercial rating. Missing frequency results remain missing; adding transmission-loss decibels with a sound-pressure summation calculator cannot reconstruct them.
Choose the marine floor assembly for the noise path
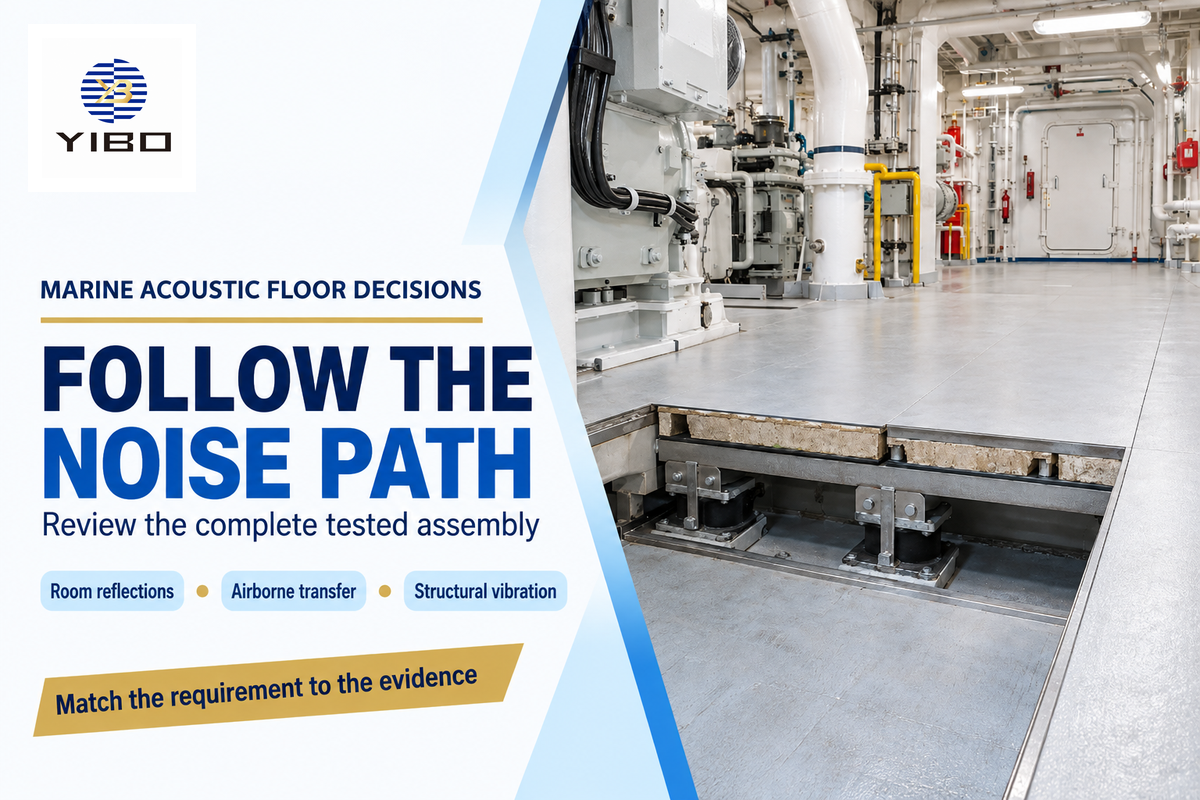
A marine floor should be selected for the path carrying the noise, be it reflections within a room, airborne transfer across a separation, or vibration through the steel structure. Exposed absorbers reduce reflected energy. Floating floors introduce resilient isolation, while damping treatments address vibration. Each choice requires supporting evidence of the assembly.
Soundproofing involves the use of materials and techniques that block or reduce sound transmission. Absorption instead helps control reverberation by reducing reflected energy. Both a noise barrier and exposed absorber help noise control, but serve different functions. Covering a porous layer changes its access to the room sound field.
Products should only be selected for acoustic absorption or sound insulation if the purchasing task requires it. Stopping sound from propagating from one cabin to another through a connected steel structure isn’t achieved by a lining that absorbs sound within one cabin. To effectively control noise, the design must address that route as well as the surface treatment.
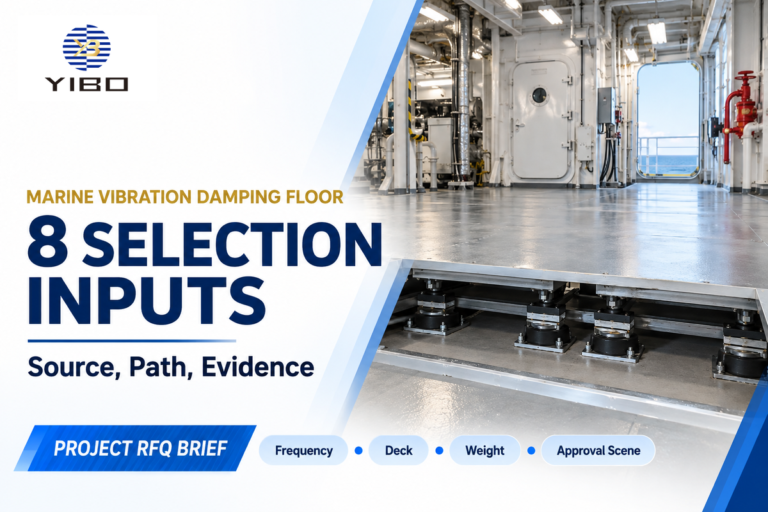
Yibo’s marine floating floor build-up lists YB-A60FIII-1 at 71.5 mm system height and no more than 63.88 kg/m². The dimensions are of this construction. The finish scope, resilient layer and perimeter details belong beside the dimensions when comparing it with another offer.
Marine constrained-layer damping targets a different structural mechanism. Deck covering layer roles distinguish the levelling base and acoustic layers from the wearing surface. A rigid attachment across a resilient interface can create a bypass path; installation review belongs with product selection.
Load is also a consideration for resilient-layer testing. ISO 9052-1 addresses dynamic stiffness under dwelling floating floors within its 0.4–4 kPa loading scope, excluding machinery foundations. Treat that as a method boundary when a report cites it, rather than transferring a residential test label into a marine approval.
For a 71.5 mm system, the available build height should include the same layers as the quoted system height. A thinner offer can delete layers or use a different construction. Resolve this scope before accepting a weight savings, and then include this in floating floor installation and handover.
Build a marine acoustic floor enquiry that suppliers can price
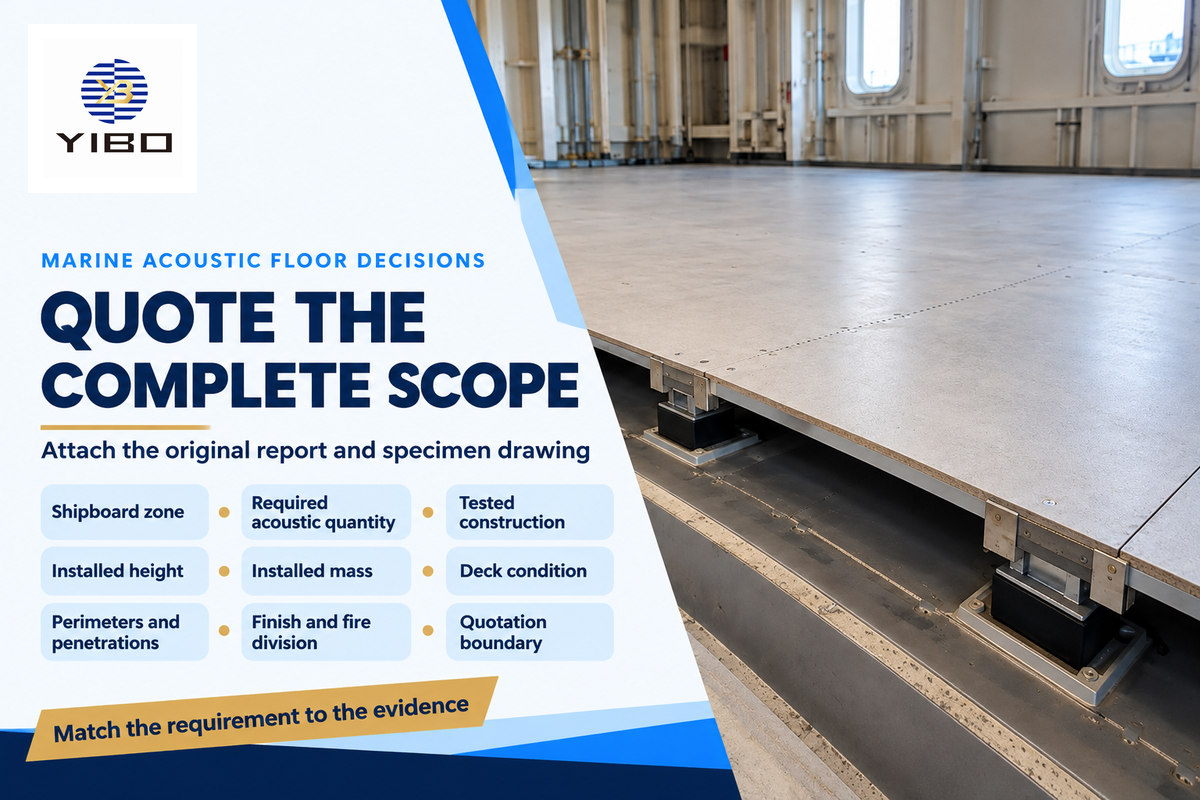
An example of a useful marine acoustic floor enquiry identifies the shipboard zone, the acoustic quantity required, and the complete installed construction. Provide the same constraints for height, mass, and finish work to the suppliers. A shared scope produces comparable responses and exposes omissions before price ranking; detailed acoustic design still follows the vessel’s source and transmission paths.
Assembly Scope Ledger
A shared list connecting the technical requirement, quoted layers and installation interfaces for one shipboard zone.
Include the following fields in the enquiry. Ask for the original report and its specimen drawing together, then confirm which proposed layers and attachments match them.
| Field | Owner | Entry needed |
|---|---|---|
| Shipboard zone | Technical reviewer | Cabin, mess or other identified space and adjacent sources |
| Required acoustic quantity | Acoustic designer | Band curve, assembly rating or onboard level, with method |
| Tested construction | Supplier | Report, specimen drawing and named product layers |
| Installed height | Yard designer | Available mm and the exact top and bottom boundaries |
| Installed mass | Supplier and yard | kg/m² for the same included layers |
| Deck condition | Installation lead | Steel condition, preparation and levelling scope |
| Perimeters and penetrations | Installation lead | Edge isolation, attachments and service crossings |
| Finish and fire division | Technical reviewer | Wearing surface and the vessel’s specified fire requirements |
| Quotation boundary | Procurement | Area, inclusions, exclusions and installation responsibility |
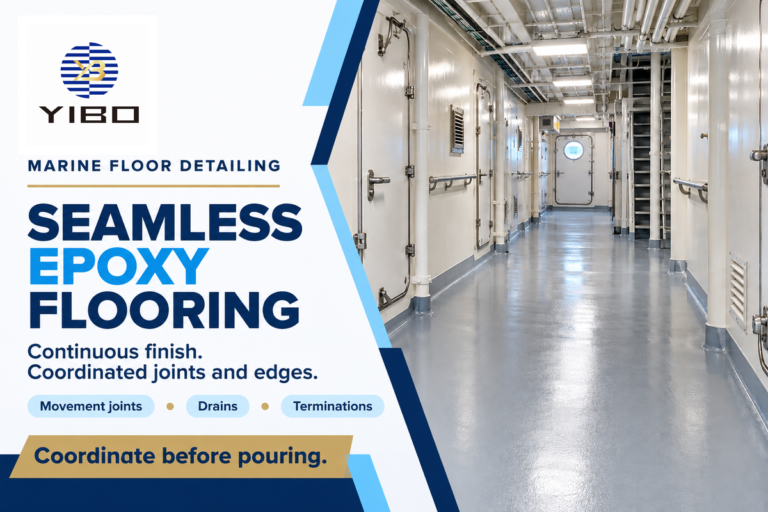
A resin floor finish modifies the supplied construction when added above the acoustic build-up. Provide its thickness and mass in the same quoted boundary. Good sound absorption in exposed materials and good floor isolation require different checks even when one supplier provides both parts of the interior.
Assess improvement of acoustic comfort within the specified zone against its original problem. Acoustic comfort within a given cabin includes both transmitted noise and reverberant sound. The wider acoustic management plan assigns those problems to the appropriate designer and supplier; one absorption rating cannot measure the complete outcome.
For teams designing spaces with optimal acoustics, a defined target is more useful than a promise of perfect sound. State the required band response or room criterion in the enquiry. Efficient sound absorption at the wrong frequencies can leave the complaint unresolved, even when the chosen material absorbs strongly elsewhere.
Key takeaway
Keep 500 Hz absorption, floor isolation in dB and onboard noise in their own measurement categories. A matched construction connects the report to the buying decision.
Send the zone drawing, acoustic requirement and completed scope ledger to Yibo for a marine acoustic floor system proposal. The first useful comparison is the same physical assembly against the same requirement.
Frequently asked questions
Can a sound absorption coefficient be greater than 1?
Yes, for some reverberation-room results.
ASTM C423 explains that diffraction can make the apparent absorption area exceed the specimen’s geometric area. Dividing those areas can produce a coefficient greater than 1. Energy is still conserved. The result describes the chamber measurement and specimen geometry, so interpreting it requires the mounting and exposed-edge details alongside the reported frequency data.
What is a good absorption coefficient?
Prefer the higher value at the frequency you need, on a matched test basis.
For the same frequency and mounting, 0.80 describes more absorption than 0.40. A low-frequency machinery problem needs performance in those lower bands, rather than a high value elsewhere in the spectrum. Choose exposed treatments using their curves and area; choose a separating floor using its assembly isolation results. These are different purchasing decisions.
What does 1 sabin equal?
One metric sabin equals 1 m² of equivalent absorption area.
An imperial sabin uses 1 ft² instead. State the convention when adding areas or comparing laboratory results, and retain the frequency attached to the measurement. An object can have an absorption area per unit, while a plane treatment can have a coefficient multiplied by exposed area. Neither form is a floor sound-insulation rating in decibels.
What is the sound absorption coefficient of cotton?
Cotton has no single coefficient.
Thickness, facing, density, mounting and frequency change the result. Select a tested cotton product by its absorption curve; a textile name alone supplies no defensible marine-floor coefficient.
What material is best for sound absorption?
Use a tested porous treatment for broad room-reflection control.
Mineral wool and foam are common candidates. Choose the construction whose frequency curve fits the problem, with suitable facing and project fire requirements; density alone can’t rank them.
Technical basis: public standards summaries, published acoustic explanations and Yibo’s product descriptions. Calculation scenarios use stated assumed inputs. Product dimensions describe named supplier constructions; the report-comparison method is an editorial procurement aid.
References & Sources
- Absorption Coefficients and Impedance Daniel A. Russell, Kettering University; hosted by Pennsylvania State University.
- ISO 354:2003 International Organization for Standardization.
- ISO 10534-2:2023 International Organization for Standardization.
- Choosing and Using Porous Absorbers Trevor Cox, Sound On Sound, 2015.
- ISO 11654:1997 International Organization for Standardization.
- ASTM E413-22 ASTM International.
- ISO 717-1:2020 International Organization for Standardization.
- Code on Noise Levels on Board Ships International Maritime Organization, official Spanish publication, 2015.
- ASTM C423-23e1 ASTM International.
- ASTM E795-23 ASTM International.
- ISO 9052-1:1989 International Organization for Standardization.