Get in touch with Yibo Company

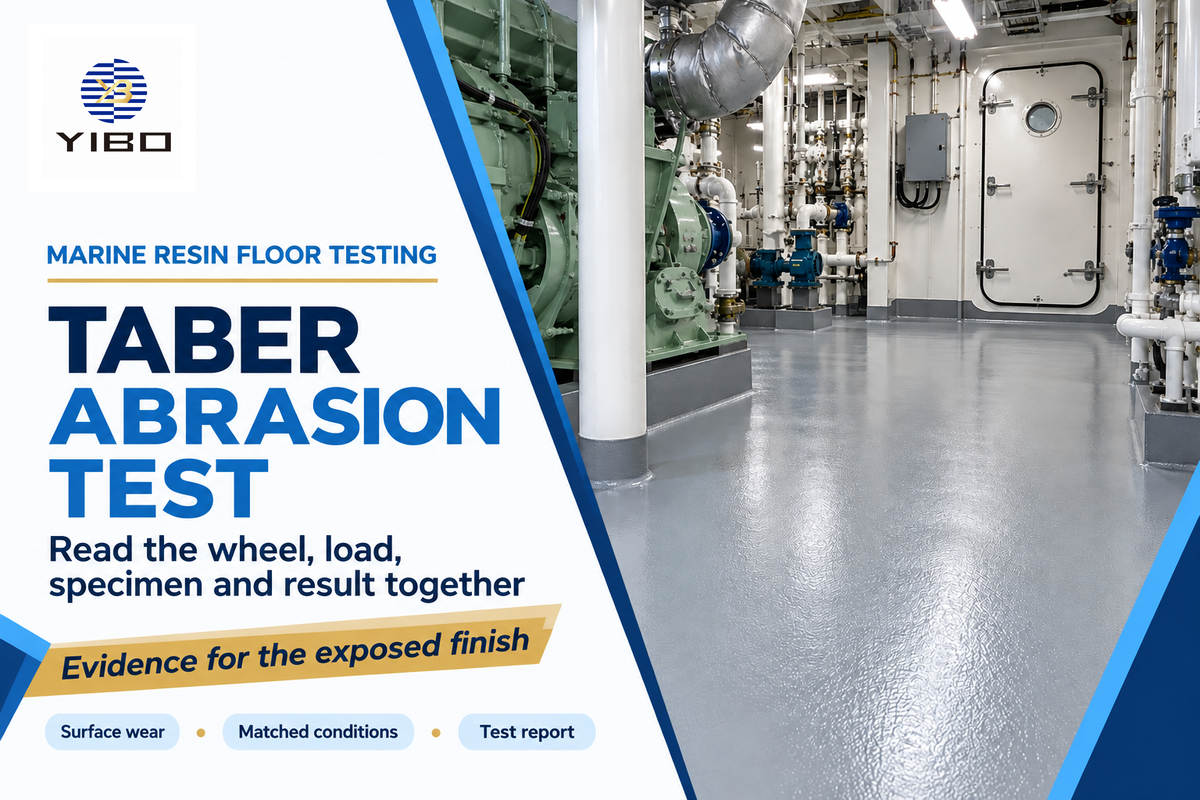
A Taber abrasion test measures the wear on a material’s surface through a controlled rotating contact. A shipyard looking for the right resin floor finish needs to know the result associated with the specimen, abrading wheels, load and exposure. A low loss without those details can put two quite different tests into the same purchasing comparison.
Updated October 2026
Taber abrasion testing measures wear from rotating contact with two abrading wheels. Report the wheel, total load per wheel, cycles and endpoint together. A wear index states milligrams lost per 1,000 cycles; compare floor coatings under matched conditions.
Quick report checks
- More mass loss can accompany less thickness loss in a dense coating.
- A 500 g load applies to each arm; it isn’t the combined load of both wheels.
- A 500-cycle test and a 1,000-cycle normalized index describe different quantities.
- Match the finished surface, including its varnish, before ranking floor systems.
What the Taber abrasion test measures
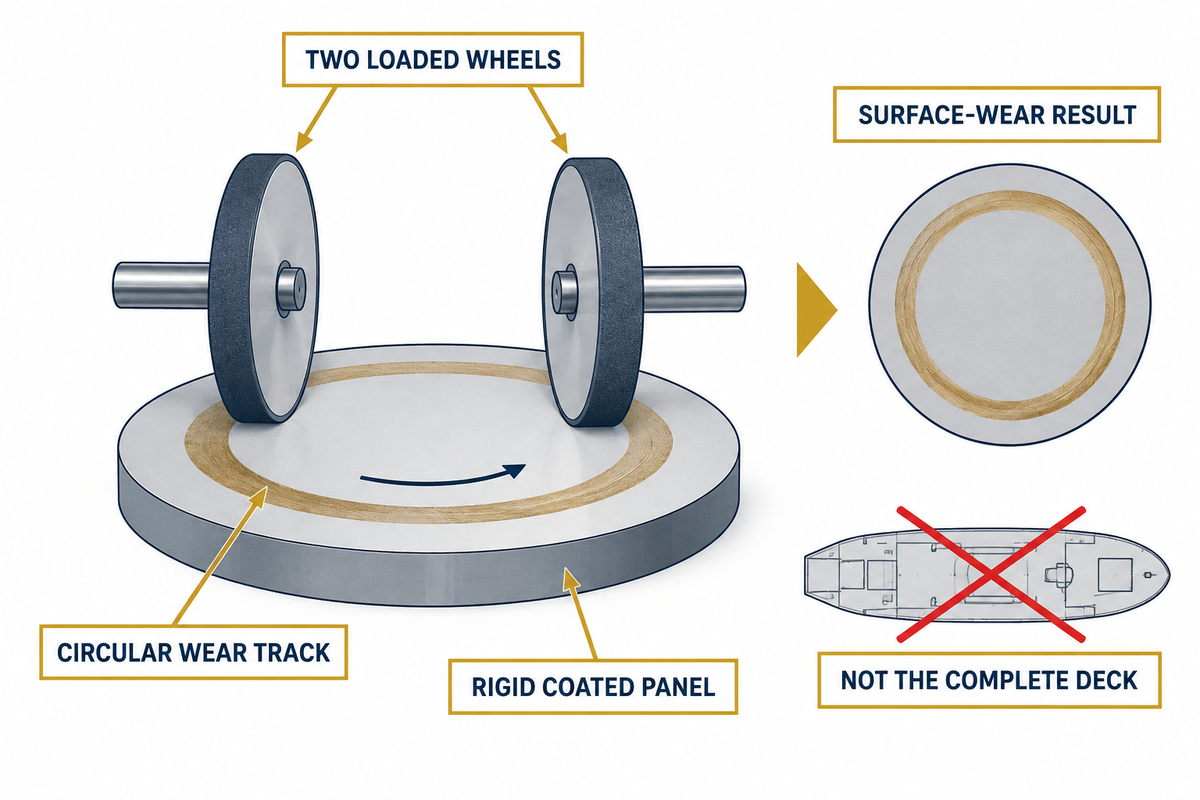
The Taber abrasion test brings two loaded wheels into rotating contact with a specimen and measures the change on its surface. For an organic floor coating on a rigid panel, mass loss is one useful measure of resistance to abrasion. The result depends on the grade of the abrading wheels, exposure and the construction of the specimen.
As the turntable rotates about a vertical axis, the two wheels produce rubbing contact over a circular track. A Taber abrasion tester holds the sample against a platform that rotates, and the abrading wheels come into contact with it. ASTM D4060-25 addresses coatings on a rigid, planar surface. This standard test method can help evaluate finishes without recreating every contact that happens on a vessel.
Which machine is used for abrasion tests?
The Taber Abraser carries the flat test specimen beneath two arms. A Taber rotary abraser is also described as a rotary abrader. A linear abraser, or reciprocating abraser creates a different contact path. Different testing instruments simulate different types of wear. Select the equipment whose method fits the component and contact action.
For marine resin floor systems, identify the exposed coating first. A measurement on a resin finish answers a surface-wear question. Assessing the wear resistance of materials is just one part of selecting the complete supporting build-up, which also accounts for the condition of the deck and other function specific needs. Those decisions are best reflected in the system specification along with the abrasion results.
A Taber rotary platform abraser uses two contact wheels, but the output need not always be mass loss. Common methods use different endpoints: Coating loss in mg, optical haze or an appearance rating. A visual grading scale can describe color loss or other visible damage, while a breakthrough endpoint describes the number of cycles to achieve wear through a coating. Matching the instrument name alone leaves the endpoint unresolved.
Choose abrading wheels and decode the applied load
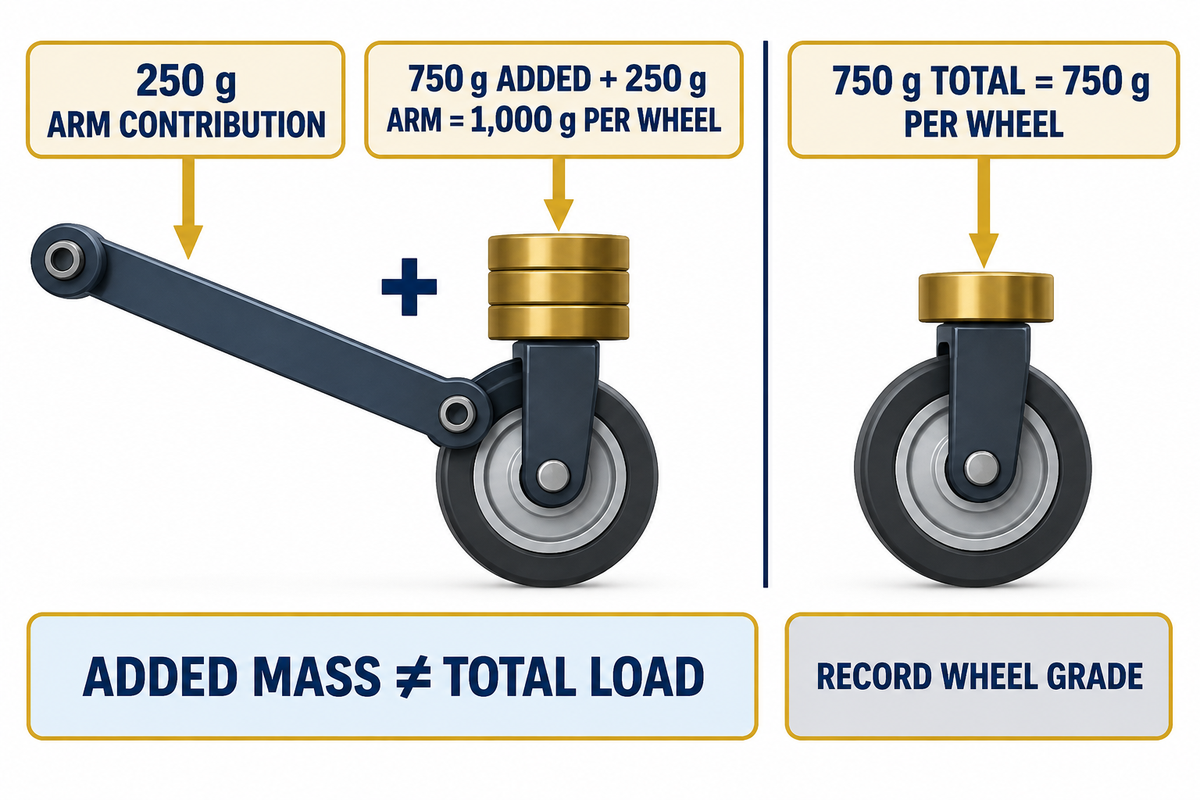
Wheel grade and load must be read together as both affect abrasive contact. Different types of abrasion give different contact conditions. CS-17 is a harsher Calibrase wheel than CS-10 in Taber Industries guidance. A report must also state the total load per wheel. The mass stamped on an auxiliary weight may not be the physical mass of the weight.
Load Label Decoder
Load Label Decoder separates the abraser arm, added weight, and total load at each wheel.
| Arrangement | Arm contribution | Added physical mass | Total per wheel |
|---|---|---|---|
| Bare arm | 250 g | 0 g | 250 g |
| Weight labelled 500 g | 250 g | 250 g | 500 g |
| Weight labelled 1,000 g | 250 g | 750 g | 1,000 g |
Source: Taber Industries weight-options instructions. The manufacturer also offers a 750 g total-load option. A report stating 750 g is therefore not automatically incorrect; the reporting convention determines its meaning. Genuine Taber weights and compatible accessories should be identified by the laboratory’s equipment record.
In Taber’s interview on reliable abrasion measurements, Alan Jaenecke explains that a 500 g designation concerns each arm. A specified 1,000 g load must not be split across two sides. Taber abrasive wheels also differ in material and cutting action. Substituting abrasion wheels while retaining the load changes the test, even when the equipment counter stops at the same number.
Let’s say a lab writes “1,000 g,” while another says “750 g added.” With a 250 g arm contribution, those entries could be describing the same total load. A third entry stating “750 g total per wheel” could be describing a different situation. Rejecting the second supplier on the label alone would be confusing weight accounting with coating performance. Once the labels are decoded, wheel grade and cycles need to also match. The decoder resolves the mass convention; it doesn’t convert the resulting wear number between different loads.
For Taber’s arrangement, 250 g arms plus a physical 750 g auxiliary weight provide 1,000 g per wheel. Alternatively, 750 g total mass remains at 750 g. Keeping added mass and applied load in separate report fields prevents a numerical label from becoming a false product difference.
Prepare and run a repeatable coating test
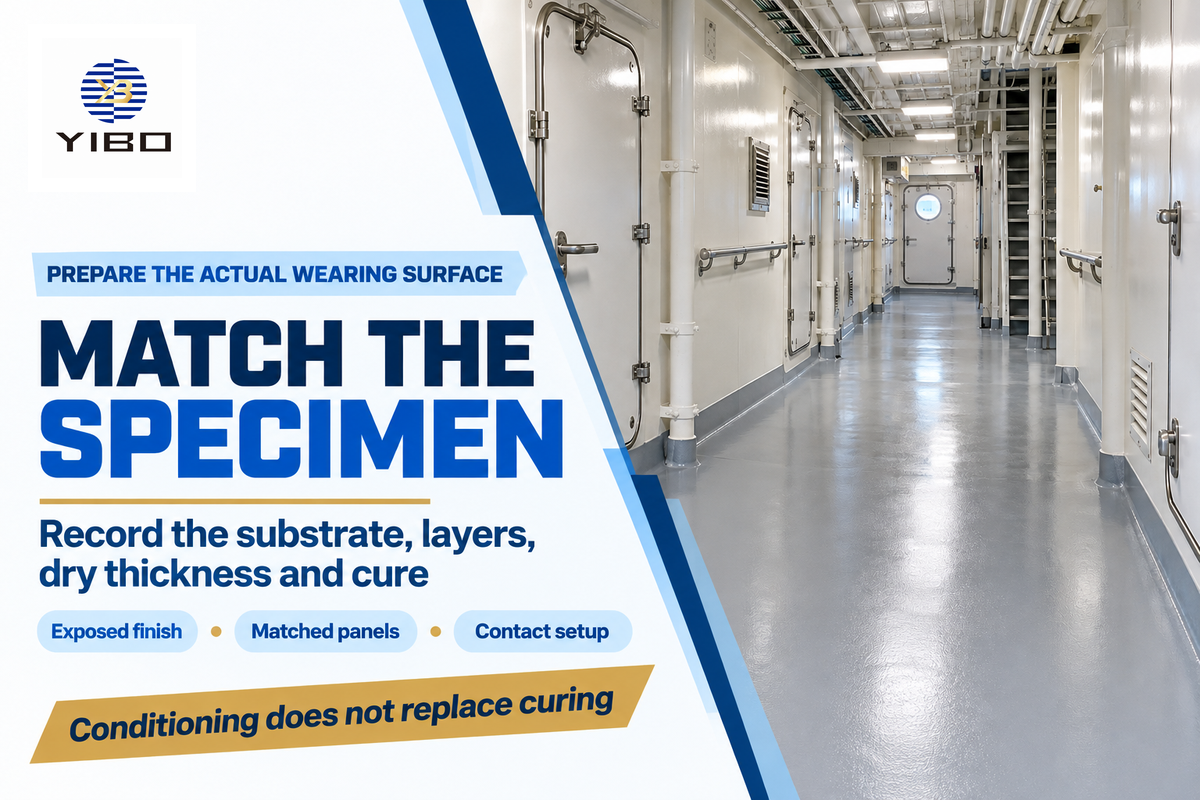
Repeatable tests require identical starting conditions. For consistent specimen and test parameters, repeatable coating tests depend on matching substrate, coating layers, film thickness and cure history. During the run, wheel conditioning and removal of foreign matter help to provide consistent contact for required comparison.
What factors should be considered when preparing a Taber wear abrasion test sample?
Use a flat rigid panel with an even coating, and the cure specified in the instructions. In case the finished layer is part of the proposed installation, include that as well. Taber’s preparation guidance distinguishes conditioning from curing: time in a controlled room doesn’t replace the coating’s cure schedule. Its technical discussion of test reliability explains how uneven films and incomplete cure can distort the result.
A laboratory coupon for E60 epoxy floor construction requires an unambiguous specimen description. Testing a thin resin film and a fully varnished surface may answer different purchasing questions. The laboratory’s testing instruments, fixture capacity and agreed test procedures determine how the representative surface is mounted.
- Identify the surface. Record resin, finish, substrate and dry thickness before preparing matching panels.
- Complete cure and conditioning. Keep the time and environmental record with the specimen identification.
- Set the contact. Record wheel grade, total load and the agreed wheel-preparation procedure.
- Weigh and run. Apply the specified cleaning, weighing, vacuum system and exposure sequence.
- Report individual outcomes. Retain each panel result, abnormalities and any endpoint reached before the planned stop.
Taber recommends 23 ± 2 °C and 50 ± 5% relative humidity as general conditioning conditions, with at least 24 hours for specimens generally and 48 hours for organic materials. The agreed upon material-specific method takes priority. The same also applies for surface cleaning. An unsuitable cleaner can alter the coating being evaluated.
Calculate mass loss and the Taber wear index
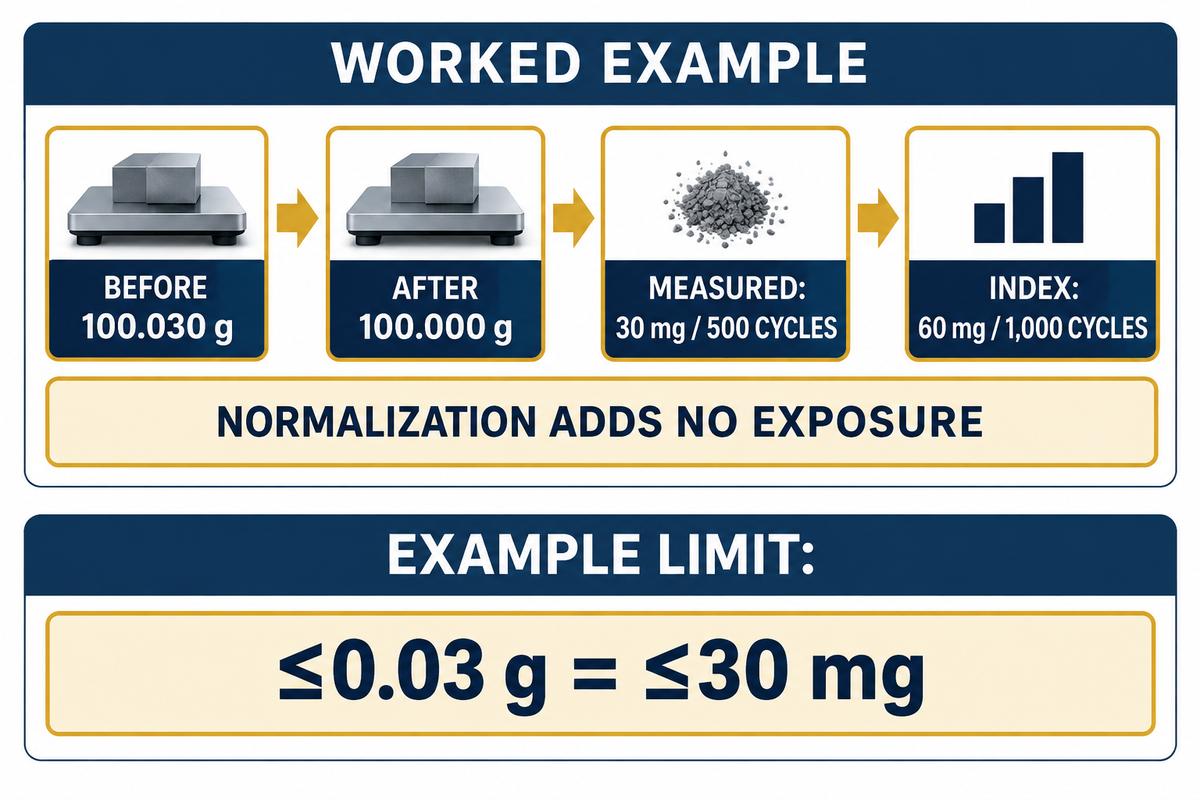
Mass loss is the specimen’s before-and-after mass difference, while the Taber wear index normalizes that difference to 1,000 cycles. For calculations, take the mass in grams and convert to milligrams. Depending on the test being performed, the count of the test cycles being performed must be indicated adjacent to the normalized result to help readers understand the exposure performed and the basis of reporting.
To calculate the wear index, the equation to be used is I = (A – B) × 1,000 ÷ C, where A and B are masses in mg and C is the number of cycles. Khakalo and colleagues’ 2020 research defines the milligram loss per thousand cycles and is an example of a methodology for modified-wood specimens and not a floor coating selection methodology.
Example: A lab records 100.030 g before abrasion and 100.000 g after. The difference is 0.030 g or 30 mg. For 500 cycles of abrasion, the loss is calculated as 30 × 1,000 ÷ 500 = 60 mg for each 1,000 cycles. Report the loss as 30 mg for 500 cycles and the normalized loss as 60 mg/1,000 cycles. The wheel and test load remain attached to both figures. The buyer can now read the units, but can’t determine that 500 additional cycles would remove another 30 mg. Varying conditions of the contact surface, wheel, or load can change the removal rate.
| Reported quantity | Value | Meaning |
|---|---|---|
| Mass difference | 0.030 g | Before mass minus after mass |
| Mass loss | 30 mg | Same difference expressed in mg |
| Normalized wear index | 60 mg/1,000 cycles | 30 mg multiplied by 1,000/500 |
A measured result belongs in the result column. A limit such as ≤0.03 g belongs in a specification column. Converting the limit to ≤30 mg preserves the inequality; replacing it with “30 mg measured” changes the claim. Neither adjusts for the effect of a different wheel or load.
Normalizing 30 mg loss over 500 cycles results in a loss of 60 mg/1,000 cycles. This adds no exposure. The original 500 cycle duration is still part of the test data. Each time a different load is tested, it should be measured; arithmetic can’t replace the measurement.
Compare coating results on matched conditions
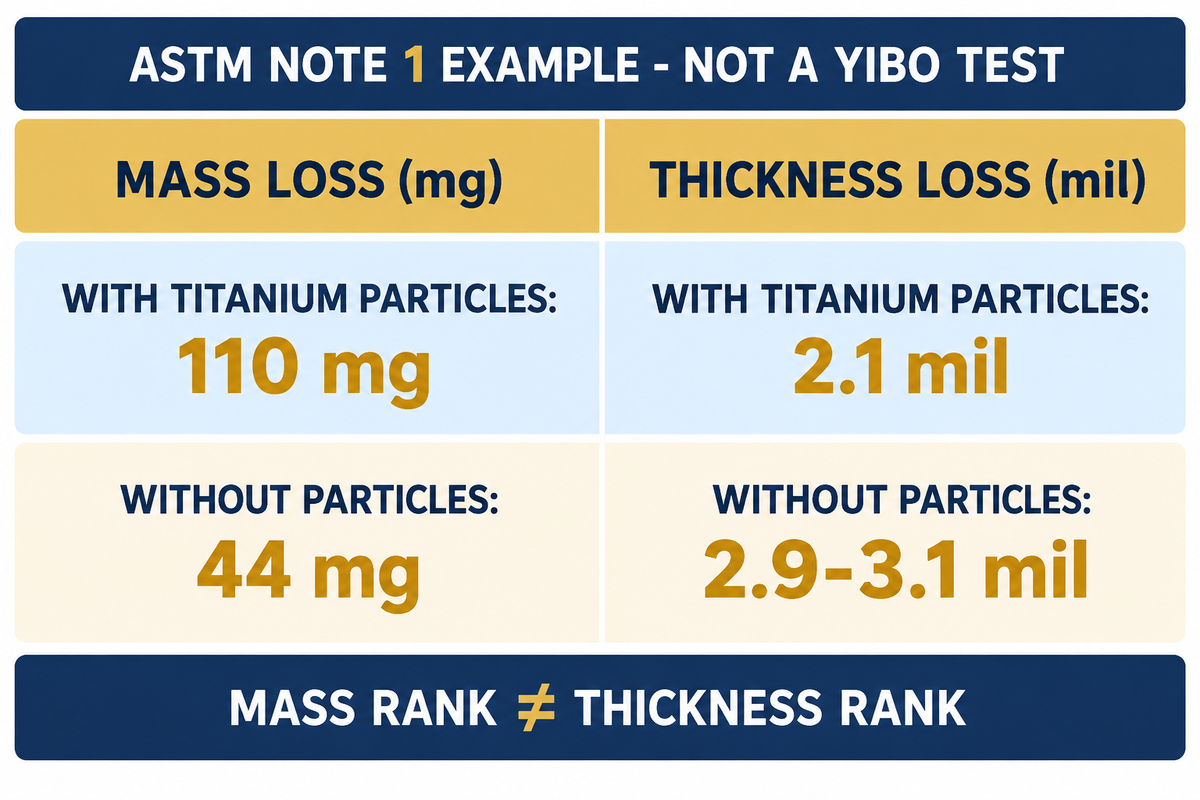
To interpret results, begin with matched conditions: coating results become comparable when the specimen and test conditions match, but small differences still need a repeatability assessment. Lower mass loss may not mean lower thickness loss. Dense fillers can change the relationship between the mass removed and the thickness of protective coating that remains.
Mass, Thickness Rank Reversal
Mass-Thickness Rank Reversal occurs when a greater mass loss coating experiences less thickness loss than a comparison coating.
ASTM D4060-25, Note 1 gives an example involving urethane coatings. A 20 mil coating containing 1.2 µm titanium particles lost 110 mg and 2.1 mil; a similar coating without those particles lost 44 mg and 2.9–3.1 mil. Choosing only by mg would favour a different specimen from choosing by thickness loss.
| Published example | Mass loss | Thickness loss |
|---|---|---|
| Urethane with titanium particles | 110 mg | 2.1 mil |
| Similar urethane without those particles | 44 mg | 2.9–3.1 mil |
This example is by ASTM, and not a Yibo Product Test. It demonstrates the reason that the broad ranking “epoxy versus polyurethane” is inappropriate for selection of polyurethane floor finishes. The formulations and the specified endpoints are critical. Wear cycles per mil, loss in coating thickness and mass loss should retain their own units.
| Check | Match or record | Decision when different |
|---|---|---|
| Method | Standard and edition | Resolve procedural differences |
| Specimen | Substrate and exposed finish | Compare representative matching surfaces |
| Film | Dry thickness and cure | Repeat with the specified preparation |
| Wheel | Grade and preparation | Use the same abrading contact |
| Load | Total g per wheel | Do not convert loss between loads |
| Exposure | Cycles and stopping point | Retain actual exposure beside index |
| Environment | Conditioning and test conditions | Review environmental differences |
| Endpoint | mg, thickness or breakthrough | Compare the same property |
| Replication | Panel count and individual spread | Assess difference against applicable precision |
The ASTM interlaboratory research report describes seven laboratories testing five materials in 2006 to establish a precision statement. The report’s public introduction gives no universal pass/fail difference in mg. A small gap between two averages should therefore be read with replicate results and the applicable precision statement, rather than turned directly into a supplier ranking.
Read changing wear before accepting an average
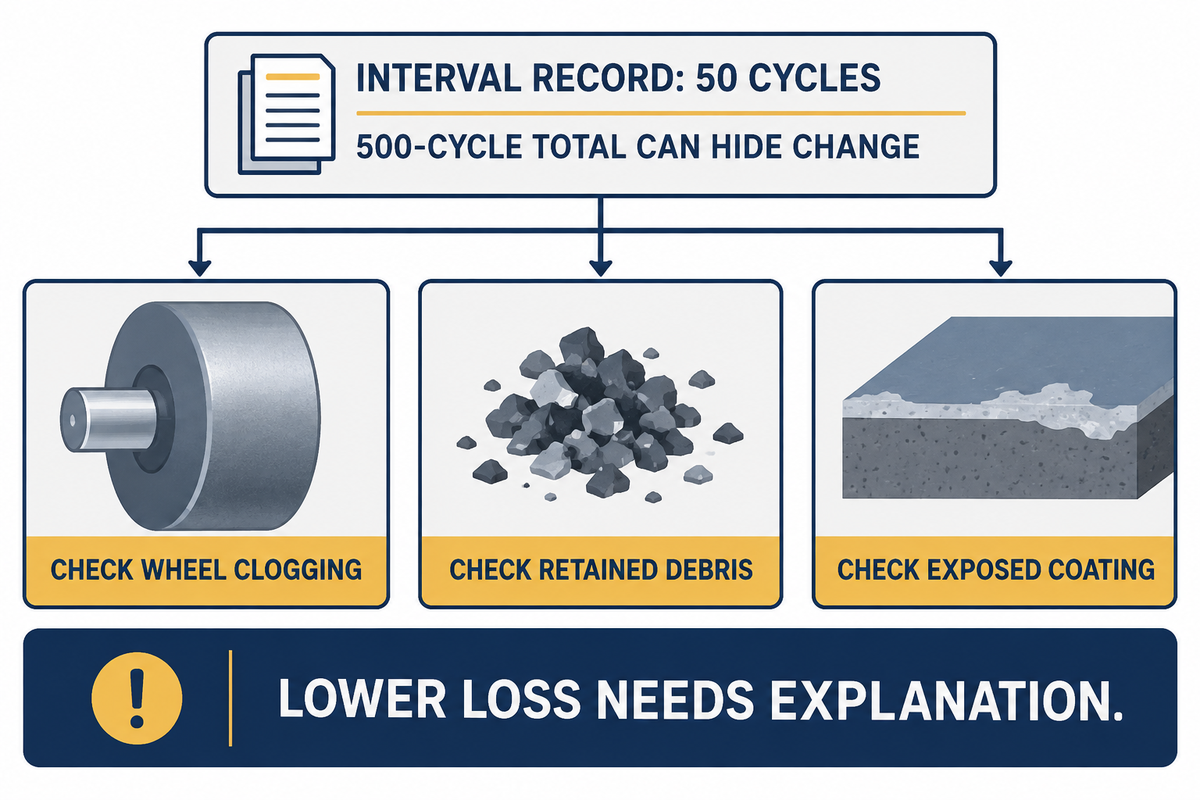
A changing wear resistance reading calls for review of the contact before accepting a single average. Clogged abrasive wheels, retained debris and changes in the exposed coating can all affect successive intervals. The useful question is which mechanism changed during the run and whether the agreed procedure still describes the comparison.
ASTM D4060-25 section 5.2 details plotting weight loss every 50 cycles to find a falling slope before 500 cycles when analyzing wheel clogging. This diagnostic interval differs from an instruction to resurface every 50 cycles. Maintenance of wheels must be done as described and as prescribed by the behavior being examined.
Debris can come from both the wheel and the coating. A NIST study published in 2020 assessed five wheels for nanocoating wear studies and noted the release of wheel fragments, wheel wear, and roughness, as a few of the limitations. Release of particles from the wheel, as noted in this study, is different from the routine acceptance of a resin floor. This serves to explain that all the particles found on the abraded sample shouldn’t be treated as coating debris.
A different 2024 nickel-matrix coating study estimated its final average over cycles 7,000 – 15,000, as the initial surface roughness affected earlier periods. That research window is not a recipe for marine finishes. It illustrates the reason a changing curve needs to be explained before averaging windows are compared.
An interval record at 50 cycles can reveal a slope change hidden inside a 500-cycle total. Analyzing the wheel and debris-removal record distinguishes a contact problem from a changing specimen surface. A lower loss shouldn’t automatically be credited to improved resistance to wear.
Order the right test for a marine resin floor
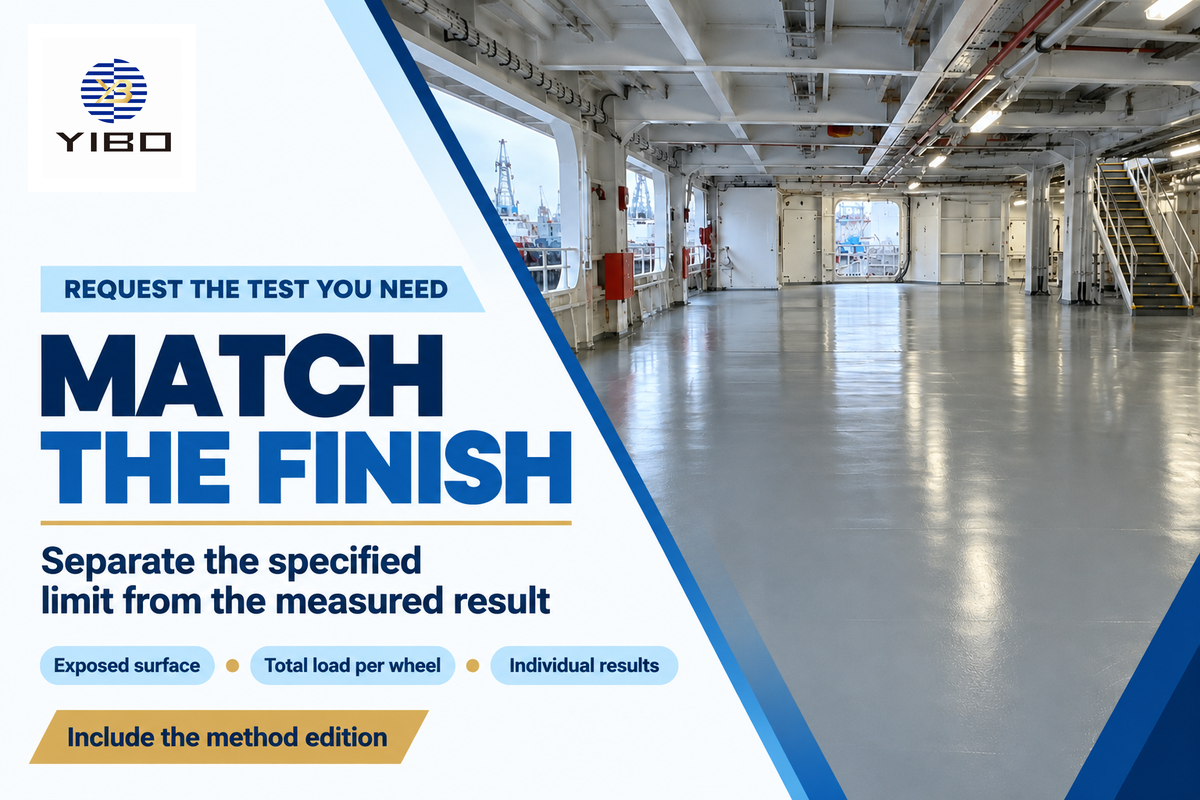
A request for a marine resin-floor test should identify the exposed finish and clarify which fields of the report are of interest for acceptance. In separating the specified loss limit from the laboratory’s test result, testing needs become apparent and define the scope of the test requested. This makes the quoted price useful to procurement and provides technical reviewers the means to trace the sample to the vessel construction.
Yibo Marine lists E60 as a 4.8 mm coloured-sand epoxy layer with a 0.2 mm polyurethane varnish, giving a 5 mm finish build-up. Its declared wear limit is ≤0.03 g at 750 g and 500 revolutions. Preserve that wording when transferring the specification into a test request, including the inequality and the load convention.
Assume a shipyard is replacing a varnished passageway finish and receives a coupon labeled only “epoxy.” The procurement team needs the proposed wearing surface represented, including the varnish if that’s the surface in service. In this case, the coupon can address the underlying resin while the crew walks on another layer. The quote for testing services should differentiate the preparation of the finished specimen from the operation of the tester. That distinction also impacts cost. Supplying ready-cured panels and asking the laboratory to prepare the coating are different scopes. Keep the wider installation decision in the existing marine floor build-up guide.
| Field group | Required entry | Purpose |
|---|---|---|
| Construction | Product, substrate, finish and thickness | Trace the exposed surface |
| Preparation | Cure and conditioning record | Keep panels comparable |
| Contact | Wheel grade and wheel preparation | Define the abrasive action |
| Loading | Total load per wheel, in g | Remove label ambiguity |
| Duration | Cycles, intervals and stopping rule | Fix the exposure |
| Debris control | Vacuum setting and nozzle arrangement | Describe particle removal |
| Evaluation | Mass loss, index or other named endpoint | Fix units and interpretation |
| Results | Individual specimens, mean and spread | Assess repeatability |
| Acceptance | Method edition, limit and deviations | Keep specification and result separate |
Confirm these items with the laboratory in one written brief before the order is approved. Include whether an E60 wear line is reproduced, or a different method is commissioned. For primary marine deck coverings the relevant requirements for the construction and finish tests should be included.
Keep the method edition and service claim in scope
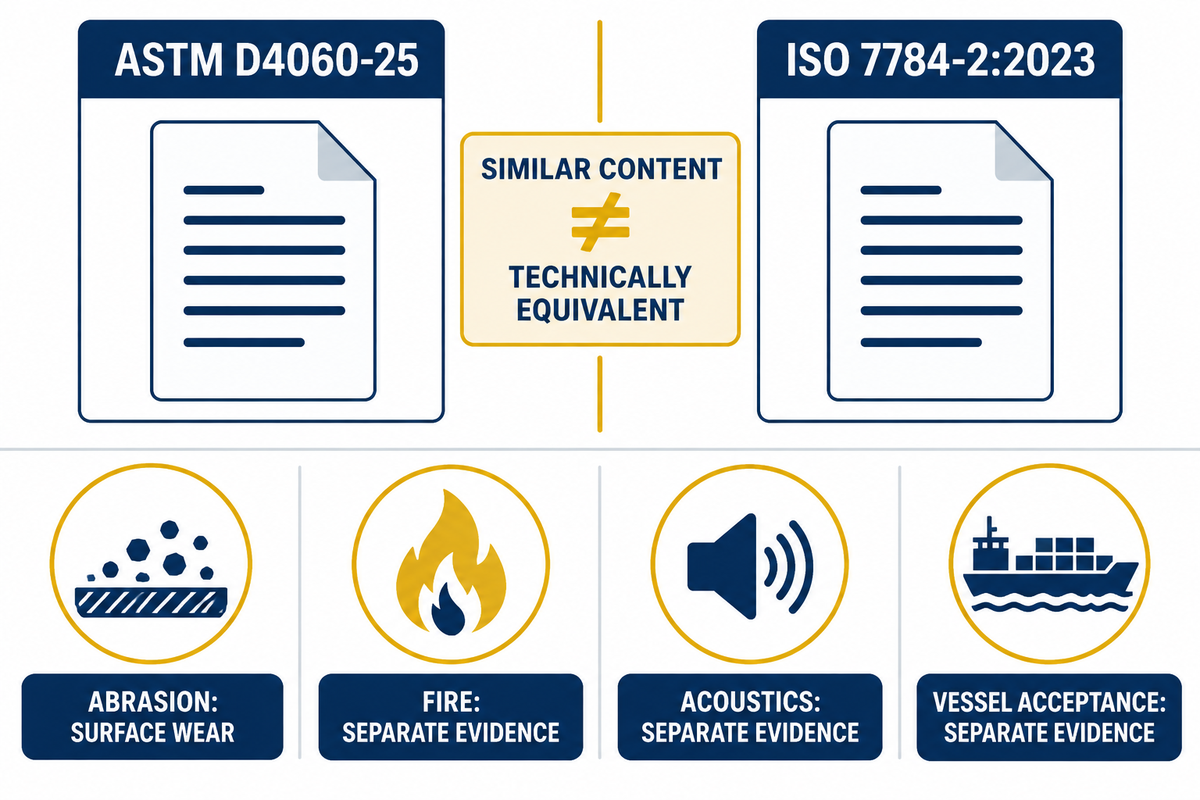
Test standards and similar such editions are in the purchase specification because abrasion tests by that name can be made by different methods. ASTM lists D4060-25 as the active standard, revised February 2025, while ISO lists 7784-2:2023 as the third edition. The contract should identify the method to be used before a laboratory comparison is ordered.
ISO 7784-2:2023 describes abrasion by loaded rubber wheels on a rotating coated specimen. Similar equipment does not make two standards interchangeable. ASTM’s public scope provides this differentiation directly.
“similar in content (but not technically equivalent)”
For a new test order, determine which edition has been agreed to and which deviations from the agreement are permitted. An existing contract can name an earlier edition. A later publication date doesn’t in itself provide ground for rejecting the results of the contract. Test method development for a special surface also requires a described procedure rather than a standard number attached to modified contact conditions.
Abrasion resistance testing addresses surface wear. Fire performance, acoustic behavior and vessel acceptance cover other functions and their respective tests and/or approvals. A low wear index doesn’t mean that the finish is a qualified complete deck construction. Select the evidence required by function, and keep each result attached to its specimen.
Key takeaway
Read a 30 mg loss together with its wheel, total load, actual cycles and finished specimen. Use the wear index to express the result consistently, then use matched conditions and replicate data to judge the comparison.
Frequently asked questions
Why is it important that wear testing be performed?
Wear testing provides a controlled comparison before a finish or formulation change is accepted.
Wear testing helps buyers compare a coating’s response to a defined rubbing action before choosing a finish or accepting a formulation change. It supports a stated laboratory comparison, rather than predicting years of deck service. Shipyards still need separate evidence for impact, traction, cleaning exposure and the proposed floor construction.
What different types of materials can TABER testing be performed on?
Rotary testers cover several material families under material-specific methods.
Rotary abrasion equipment can test several material families, including organic coatings, plastics and textiles, when the relevant method and specimen holder permit it. The endpoint changes with the material: a coating mass-loss result is different from plastic haze or fabric damage. Choose the material-specific standard before comparing any reported number.
Why do temperature and humidity matter in Taber abrasion testing?
Temperature and humidity affect conditioning and weighing consistency.
Temperature and humidity can affect specimen conditioning and the mass measured before and after abrasion. A report should therefore identify the applicable conditioning procedure and test environment. For a resin coating, the cure schedule also matters. Compare panels prepared and conditioned on the same basis, rather than correcting unexplained differences numerically.
What is the difference between an attrition test and an abrasion test?
Attrition concerns particle breakdown; abrasion concerns wear at contacting surfaces.
Abrasion describes wear caused by rubbing or scraping contact. Attrition commonly concerns particles breaking down through repeated contact in a bulk material. A particle-size or fines result therefore answers a different question from the surface wear of a coated panel.
What other factors matter when choosing an abrasion tester?
Match the tester to the specimen shape and intended contact action.
Start with the material shape, the specified contact action and the result the project needs. A flat coated panel may suit a rotary platform abraser, while a shaped component or reciprocating contact can require another instrument and method. Check specimen mounting, available wheels or abradants, load control, debris removal and the laboratory’s applicable scope. Buying the instrument with the highest stated load does not ensure a more relevant test. Obtain a method-specific demonstration using representative specimens before selecting equipment.
Does a low wear index prove marine approval?
A wear index is not marine approval.
No. A low wear index describes one abrasion result under its recorded conditions. Marine approval addresses the applicable product or construction and its stated approval scope. Keep the wear report separate from fire, acoustic and vessel acceptance documentation during technical review.
How much does a laboratory abrasion test cost?
The laboratory quotation must price the complete preparation and testing scope.
Laboratories price the named method and work scope, including specimen preparation, conditioning, panel count, exposure and report deliverables. A headline testing fee can exclude applying the coating or investigating an abnormal curve. For a shipyard comparison, send both laboratories the same specimen and reporting brief. Compare preparation, repeat testing and the results supplied with each quotation. Supplying ready-cured panels is a different order from commissioning coated specimens, even when both quotations name the same abrasion tester and cycle count.
Yibo Marine’s perspective is the relationship between the proposed marine floor finish and its test report. Published standards and attributed technical research inform the interpretation here; the worked calculation uses assumed inputs. Product-specific acceptance should use the specified construction and the corresponding laboratory results.
Planning a resin finish for a commercial vessel? Send Yibo Marine the deck area, intended finish build-up and the required abrasion-report conditions so the product discussion follows the same specimen and acceptance brief.
References & Sources
- ASTM International: D4060-25, public scope and significance
- AZoM: Taber interview on obtaining reliable abrasion results, 2021
- Khakalo et al.: modified-wood study, ACS Applied Materials & Interfaces, 2020
- ASTM International: RR:D01-1135 precision study introduction, 2007
- NIST: abrasion-wheel selection research, 2020
- Frontiers: nickel-matrix composite coating wear study, 2024
- ISO: 7784-2:2023 official catalogue